BMI Chart
Utilizing Body Mass Index (BMI) is one way an individual can find whether or not their weight is healthy for them. BMI takes both weight and height into consideration. Carrying a lot or little weight might raise an individual’s risk of health disorders either in the future or in the present. An individual’s BMI is not the only reason that affects this risk. Other assessing tools whether a person consists of body composition or healthy weight for them consist of body fat percentage, waist to height ratio, and waist to hip ratio. Therefore, BMI helps start point. (5)
For the utilization of BMI charts, an individual can look at their weight in pounds also with top and their height in inches and feet. They can also look across to search their BMI. There are two BMI charts. If an individual’s weight is around 245 pounds (lb) or below, they must utilize the first chart. If their weight is above 250 pounds (lb), they must look at the other chart. The areas that are dark in color are related to the BMI values that show either overweight, moderate weight or obesity.
Additionally, doctors and researchers classify obesity into three groups:
- Class 1: BMI is 30–34.9.
- Class 2: BMI is 35–39.9.
- Class 3: BMI is 40 and above.
These are only for your guidance. The BMI tools do not find either if not an individual is having ideal body weight, but they might aid in showing if a person’s weight might raise their risk of disease. An individual who is quite fit, such as an athlete, might have an increasing BMI. Therefore, this does not significantly mean that they start considering in overweight category because of excessive body fat. The excess weight, in case, might be because of increased muscle mass.
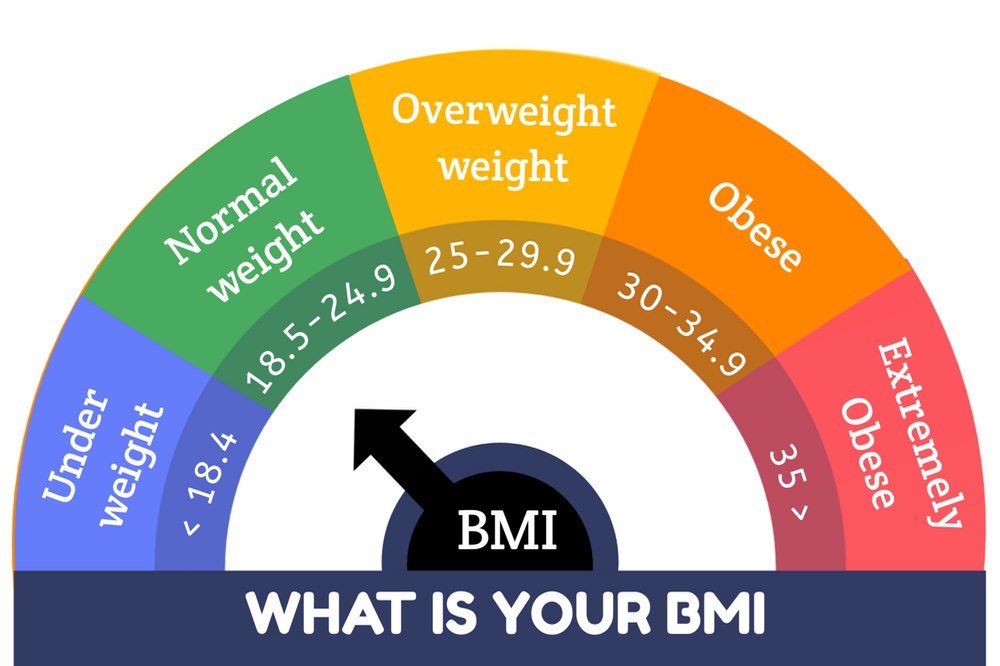
The following table indicates the moderate weight status classifies associate with the range of BMI of adults:
Below 18.5
Underweight
18.5–24.9
Healthy
25–29.9
Overweight
30 and above
Obese
Underweight
< 18.50
< 18.50
Severe thinness
< 16
< 16
Moderate thinness
16–16.99
16–16.99
Mild thinness
17–18.49
17–18.49
Normal range
18.5–24.99
18.5–22.99
23–24.99
Overweight
≥ 25
≥ 25
Pre-obese
25–29.99
25–27.49
27.5–29.99
Obese
≥ 30
≥ 30
Obese class 1
30–34.99
30–32.49
32.5–34.99
Obese class 2
35–39.99
35–37.49
37.5–39.99
Obese class 3
≥ 40
≥ 40
Maintaining a normal weight might help prevent various health conditions. People who might be overweight or at risk of certain health conditions such as type 2 diabetes, heart diseases, colorectal cancer, and sleep apnea. Some of them might be life-threatening. BMI is a helpful tool that provides a typical idea regarding an individual’s weight is healthy or not for them. Therefore, it is an easy tool that does not explain the whole story regarding an individual’s health risks and weight. Anyone who concerns regarding their weight must visit a doctor, dietitian, or nutritionist, who might consider their distribution of body fat and the ratio of height and waist size.